
In the 90s, during my adolescence time, I experienced the developing phase of Personal Computers. Computer stores sprang up in every neighborhood of my city and the sale of components and software had a golden age. I and my friends were used to talk about computer science and electronics, we liked to enter computer stores to find the latest products of a constantly evolving market. We had pleasure to buy basic components such as processors, cards and monitors, and then to spent our free time assembling them at home, many times with satisfactory results! Unfortunately, in the 2000s Personal Computers gradually became more sophisticated products, in the large electronics megastore you could find products ready to use and with low prices, without the opportunity of customizing them, conseguently the idea of self-assembled PCs became unknown, at the same way of other electronic consumer products that arrived later on the market, such as smartphones and tablets.
In this way, I believe that I lived in a romantic period, it was not so strange to see group of friends sitting around a table with a completely disassembled computer in the center, as if we were medical doctor in the operating room! This was an hobby for us, but after many years I realized that it was an on-the-job training for our minds: electronics and information technologies are not made up of black boxes, we must choose products that allow us to understand how inner parts work and, if needed, to suit our needs. I still have this behavior and even if I now “play” technical analysis of financial markets, I prefer the way that leads to full control of my analysis, which crosses through spreadsheets such as Excel or programming languages, rather than using specific software such as TradingView or Pro Real Time, perfect examples of “black boxes”.
In this article, using the latest information technologies and the good performance of our computers and smartphones, I will show you how it is possible to carry out a technical analysis while keeping under control each step. Especially, we are going to see how to simulate a Trading System and how to backtest it, implementing a single stock and its simple moving average (SMA): buy the stock when price crosses over its simple moving average, sell it when price crosses under. It seems a silly Trading System, but we can use it as a case study and as a starting point to develop more elaborate strategies.
To do this, we need three things: a programming language, a time series, and an environment. Let’s see below what I use, based on two fundamentals, free access (no registration or installation required) and no cost (it’s always welcome):
- Python is a programming language, one of the most used in the world. Its main advantage is its clean and powerful syntax, it runs in any operating systems and it is used for a lot of applications ranging from the web to numerical computations, from data analysis to finance. It is available for free and there are many online courses and tutorials to learn how to use it.
- To have time series is very important, without them our Trading Systems are empty boxes. Here we are going to use Yahoo Finance: the American firm provides an open and free web service that can be queried to return the time series in text format for any stocks, indexes or ETFs listed on the main world stock exchanges.
- Google Research made a software called Colaboratory, abbreviated to “Colab“. Colab allows anyone to write and execute any Python codes on any browsers. When launched, the code is executed on Google’s servers, without invoking your computer’s resources. It is available for free, no installation is required and the files created are stored in your Google Drive space.
It seems easy and… after all it is! The only requirement is that we have our own Google account and a web browser (Chrome, Firefox, Safari, etc …). I recommend that you work with a Personal Computer the first times, to get experience with Python and Colab, then you can also use them on your smartphone, wherever you are.
The software
First step, download the following file, unzip and put it inside a folder of your computer:
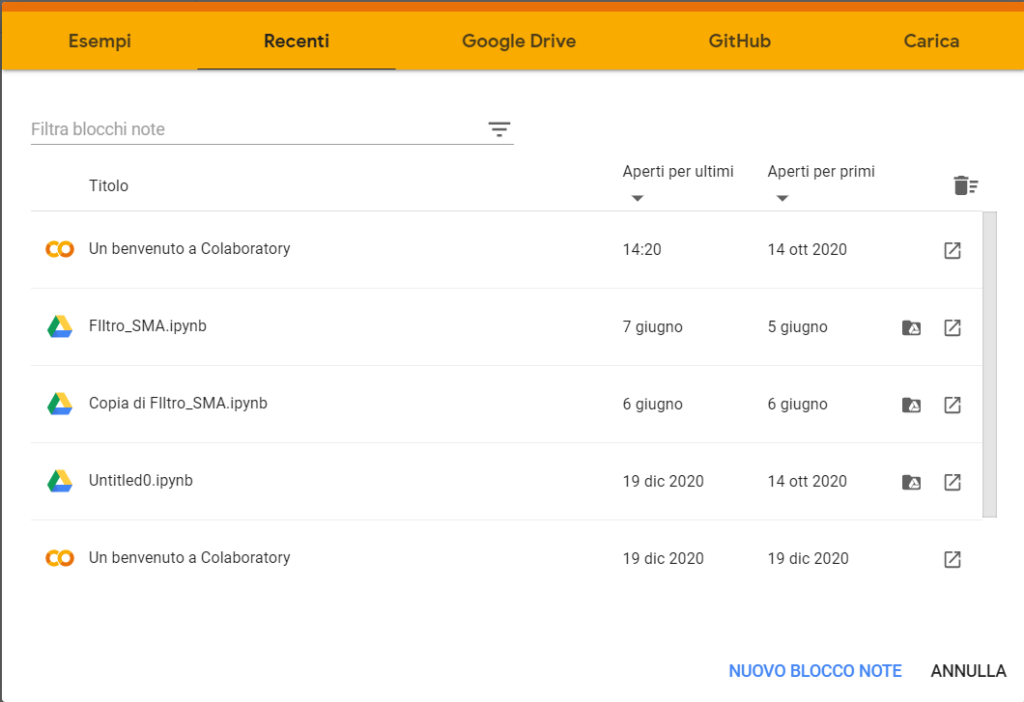
Link to the following site https://research.google.com/colaboratory/ and log in with your Google account. Once logged in, you should see a window as in figure 1, then select “Upload” and look for the file you downloaded previously. In case this window is not here, you can always click to the menu bar and choose file –> load notebook.
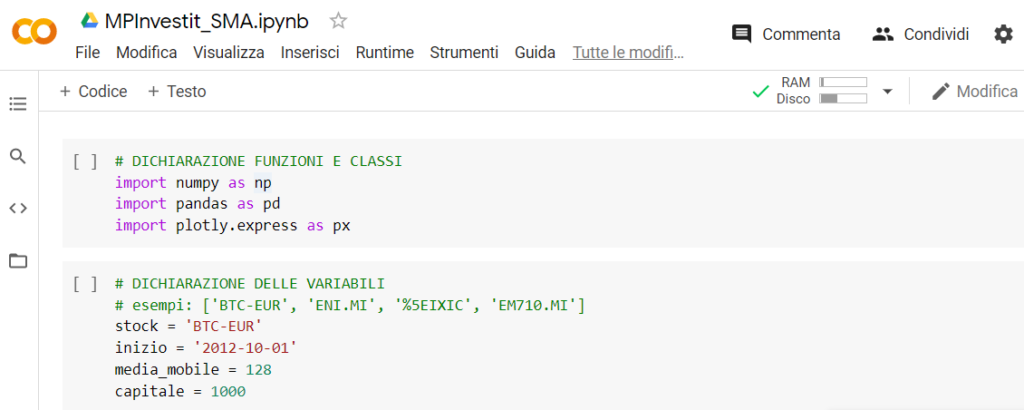
Well, at this point you should see the code of the program I wrote, as shown in figure 2. Without exploring the inner side of the code, let’s see the main blocks that make up this file:
- After the first block, with the import of the libraries, we find the block with variables declaration. It is the most important part, where we enter the input of our Trading System.
- The “stock” variable is related to the stock we want to analyze. This must be written so that Yahoo Finance is able to recognize it, for instance with shares and ETFs listed on Borsa Italiana the ticker is followed by “.MI” (ENI.MI, CSSPX.MI), for US shares only the ticker is used (TSLA, MRNA, etc…), for the indices the ticker preceded by “%5E” is used (%5EIXIC for Nasdaq, %5EDJI for Dow Jones).
- The “inizio” variable loads the starting date for our time series to analyze. In the case of the selected stock has a starting date after variable value (for example, stocks listed for a few months, such as Coinbase), the software takes the new date without claiming an error.
- “media_mobile” variable, where the range how to calculate the moving average is defined. It is essential that the variable is an integer, otherwise the software raises an error.
- The “capitale” variable is the initial equity of our portfolio.
- The two following blocks are the heart of the program. The Python code takes the price’s time series for the chosen stock from the Yahoo site, then it processes the data and calculates the SMA and two Equity Lines, one with SMA filter and one without.
- The final blocks create two figures, first one has the time trend of the price and of the SMA, the second the two Equity Lines, finally an Excel file with all the results is created by the program.
To use this software, simply set your data in the “variables” block and then select “Runtime” in the menu bar, followed by “Run All”. Let Colab to process the data and to visualize the results, which you can find at the bottom of the page.
Let’s take the following data as example:
- stock = ‘BTC-EUR’
- inizio = ’01-01-2012’
- media_mobile = 128
- capitale = 1000
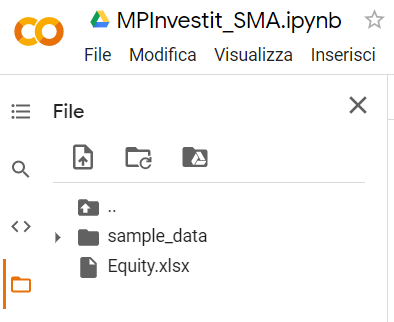
In this way, we are asking our software to retrieve the daily prices of Bitcoin quoted in Euro, to use only the prices after January 1st 2012, to use a 128-days moving average and to start with a equity of 1000 €. The software will create two interactive graphs, which allow you to zoom or save them for later use. About the Excel file, Colab saves it with the name “Equity.xlsx” and the file is visible in the left sidebar (figure 3), then if we want to bring it to our own computer or smartphone, just click on it with the right button.
After taking some practice, I’m sure you will find this tool useful, that makes simplicity its main feature! Unfortunately, there is a sore point, if from one side Yahoo Finance time series are incredibly easy to get, on the other hand their quality is not excellent: a lot of series are missing, as for Bitcoin quoted in Euro where the data are available only from 2019, as well as some indices, where the absence of S&P500 affects. For stocks there are no particular issues, the data are complete and with many years of depth. After all, there is no complain, “you get what you pay for!”.


Conclusion
My generation had the opportunity to experience the transition phase from a pure analogue technology to a digital one, to watch the mass adoption of the internet, e-mail, SMS, MP3, personal computers and smartphones. The complexity was still low, everyone with a passion for information technology and electronics had a clear understanding how items are made and how they work. With this mindset, which the machine must be steered to the needs of the user, I created this software that shows you all the operations inside and it allows you to have the control. For the most hands-on programmer, I am sure the software won’t be difficult to modify and customize the code to your pleasure, obtaining new analysis.
Happy coding and happy trading!
If you have any questions to ask me, do not hesitate to write to me in the form below, otherwise you can find me on Facebook and LinkedIn. If you want to stay up-to-date and not miss any article as soon as it comes out, subscribe to the newsletter by filling out the following form:
If you like my articles and MP Investit project, you can support me with a free donation with PayPal or with a Brave browser reward. This encourage me to produce better and better content. Thank you!